Data Analysis — functional guide
Use the legacy manager dashboard to review a team population and move from charts to supporting employee lists. This guide covers the supplied dashboard route, rather than external BI reporting.
Before you begin
Managers and HR users need an authenticated manager context, dashboard access, enabled tabs and a populated team hierarchy. HR-wide visibility is conditional; an HR title alone does not establish access. See the configuration guide.
Perimeter means the selected population; N − 1 / N − x identifies hierarchy levels relative to the manager. Mastery compares held skills with job requirements; motivation is a separate measure. Campaign results depend on the campaign type and participants.
Analyse your team’s data
Open and choose a population
- Use Spaces → Manager area, then Analytics → dashboards, or open the legacy dashboard.
- Select an enabled tab. The first enabled tab is initially active; changing tabs loads its data.
- Open the population filter, choose levels and any available relationships, then use the apply action.
- Check the perimeter count before interpreting a chart. An authorized administrator can open the people icon to inspect names and email addresses in the current perimeter.
- Choose chart segments or table rows to inspect the supporting employees, where that chart supports interaction.
Changing filters and chart selections changes the displayed analysis, not employees’ stored assessments. Filters are shared across tabs; some tab-specific controls update only one chart or detail panel.
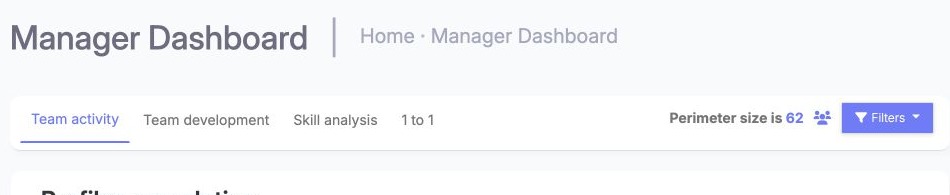
The tabs select an analysis area; the population count and Filters remain above them. Choose the scope before interpreting a chart, then open the tab for the question you want to answer. Manager view, English, 22 October 2026. The application still calls this page “Manager Dashboard”; “Data Analysis” is the documentation name.
Population controls
| Control | Choices and initial state | Effect and how to use it |
|---|---|---|
| Hierarchy levels | Multiple checkboxes from N − 1 to the available depth. The template checks the first level and restores matching session selections. | Choose one or more levels, then apply. Uncheck a level and apply to remove it. The first-level fallback means a reload is not a guaranteed exact restoration of a prior selection. |
| All my levels | One convenience checkbox. | Selects or clears the available hierarchy levels; it does not mean unrestricted company access. |
| Hierarchical relationships | Multiple tenant-defined checkboxes, only when enabled and relationships exist for the current user. No verified universal label list. | Adds employees linked to the manager by selected relationships. In activity, proficiency, skills and skills-map campaign paths, relationship employees are combined with hierarchy employees using OR. |
| All Employees | Conditional administrator option. | Selects the company population. Availability depends on administrator access; selecting it does not grant access. |
| Apply | Explicit action. | Reloads the active tab and stores its filter selection in the session. Keep at least one level or relationship. No dedicated global reset is established. |
Closing the dropdown without applying attempts to discard unapplied selections and restore the prior selection if none remains. Reapply deliberately and check the perimeter rather than assuming every checkbox change took effect. The script can hide the filter controls for the simplest single-level layout.
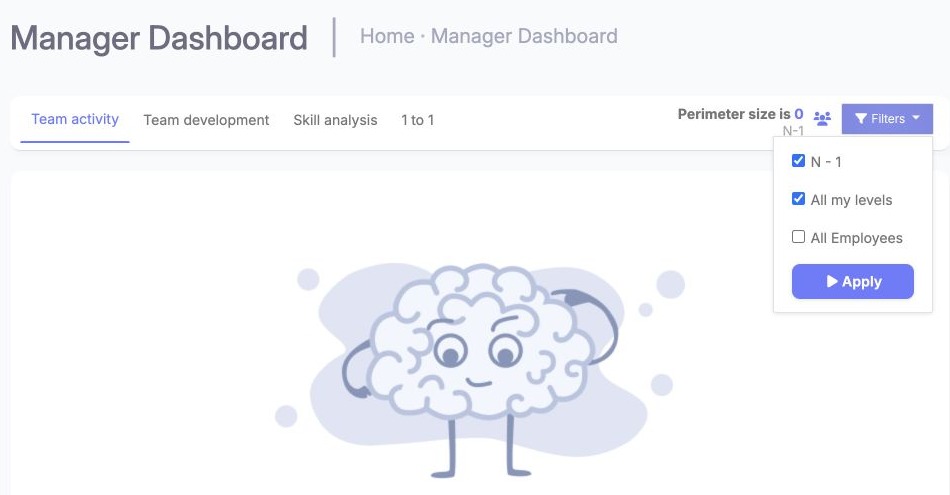
The open Filters menu contains hierarchy and broader population choices. Review the checked options, then use Apply to refresh the analysis population; the count describes the resulting scope.
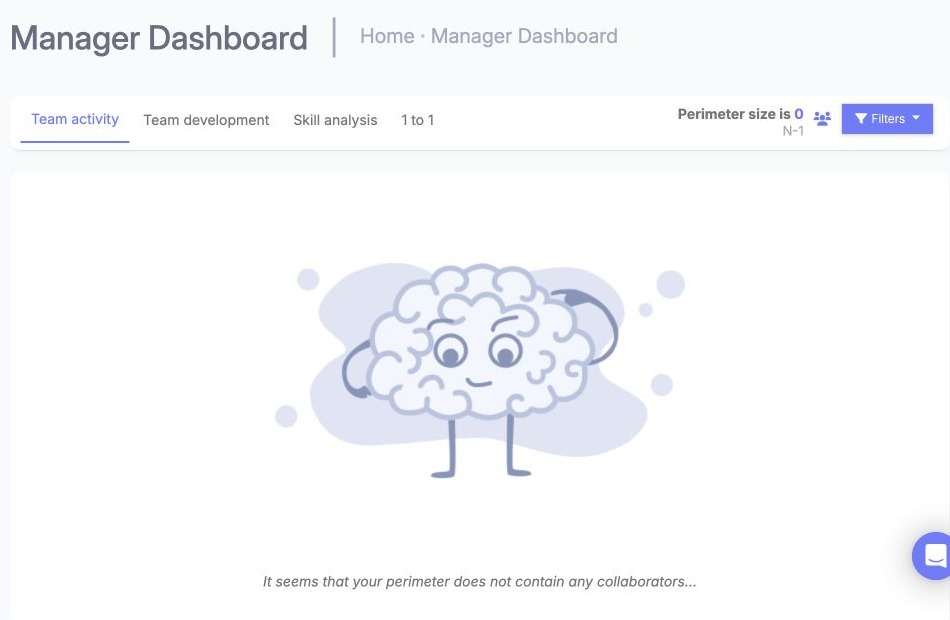
When the selected population contains no employees, return to Filters and review the scope. An empty population does not measure employee performance or skill level.
The 1 to 1 tab can handle hierarchy relationships differently from other tabs. Use hierarchy levels when reviewing interview progress and check the displayed perimeter.
Team activity
When enabled, the profile-completion chart groups employees by how much of their profile is complete.
- Select an interactive completion segment to display its employees in the linked table.
- Read the employee details for that segment.
- Deselect the segment or clear the table search to return to the wider population.
Profile completion measures profile information, not skill mastery.
Where available, login activity covers six weeks. Weekly employee counts and total login counts have different meanings; use the employee details to review the underlying activity.
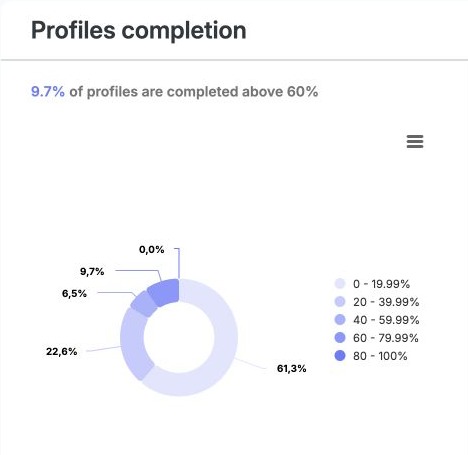
The donut groups profiles by completion percentage. Use its legend to identify a band, then select an interactive segment to inspect the associated employees; these percentages describe profile completeness.

The table heading identifies the completion band selected in the chart. Read the associated employee table in that scope; the download icon belongs to this table, rather than to the whole dashboard.
Login activity may also be available, depending on the dashboard configuration. Its chart uses a six-week interval; an arbitrary date-range picker is not available on this page.
Team development
Enabled panels can show job mastery, average gaps by job or employee, skills with gaps, motivation and job representation. Read the chart’s own unit and denominator before comparing panels.
Where enabled, a single job selector limits its associated panel to a job from the available population; clearing it removes that restriction. It does not replace the global population.
Job representation initially groups jobs representing 2% or less of the population. The optional checkbox switches between grouped and detailed representation. It is hidden when there are no small groups to expand. It changes presentation, not assignments.
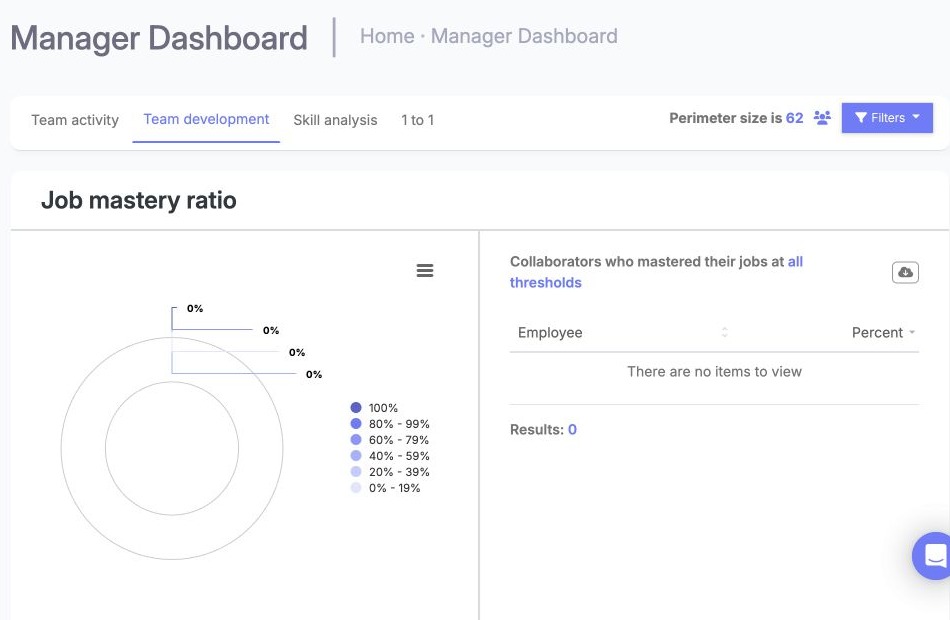
If the job-mastery panel has no rows, review the scope and available job and skill data before drawing a conclusion. An empty table does not establish zero mastery.
Skill analysis
Enabled panels cover team skills, coverage, motivation, average levels and their distribution, additional skills, and the most or least mastered skills.
- Select a skill row to open its linked employee panel, when available.
- Read the employee detail. Select the same row again to close it.
- If the panel offers a job selector, choose a job to restrict that panel. Clear the selector to remove the restriction; the panel updates immediately.
Do not equate a high average skill level with meeting a job-specific expected level. Consult the mastery/gap panels for that question. The Confluence matrix FAQ describes the manager matrix as a team-level view and directs individual skill review to the employee profile’s skills tab (Documented in Confluence, version 1, 24 September 2026).
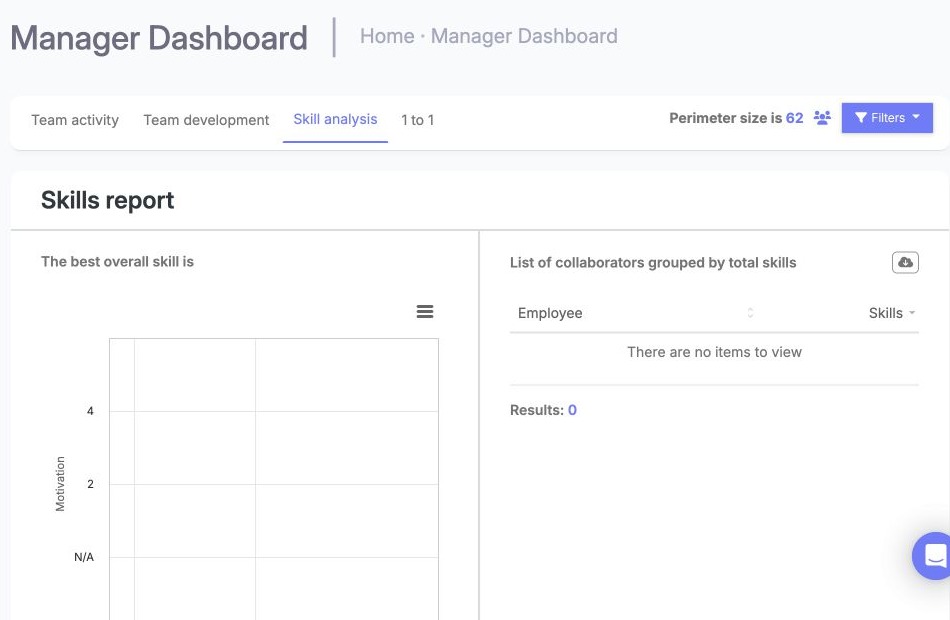
If the chart or linked list contains no skill results, check the population and source data before comparing skills. An empty chart frame is not an assessment.
1 to 1
- Open 1 to 1 and choose one available campaign in the selector.
- Read the progress detail loaded for that campaign.
- Clear the selector to remove the detail.
Available campaigns depend on the selected manager population. No fixed campaign list or automatic selection is established.
Progress distinguishes not started, employee preparation started/completed, manager preparation, both prepared, interview, manager signature and both signatures. These are analysis categories; selecting a chart segment does not advance an interview or send a reminder. See Interviews for interview work.
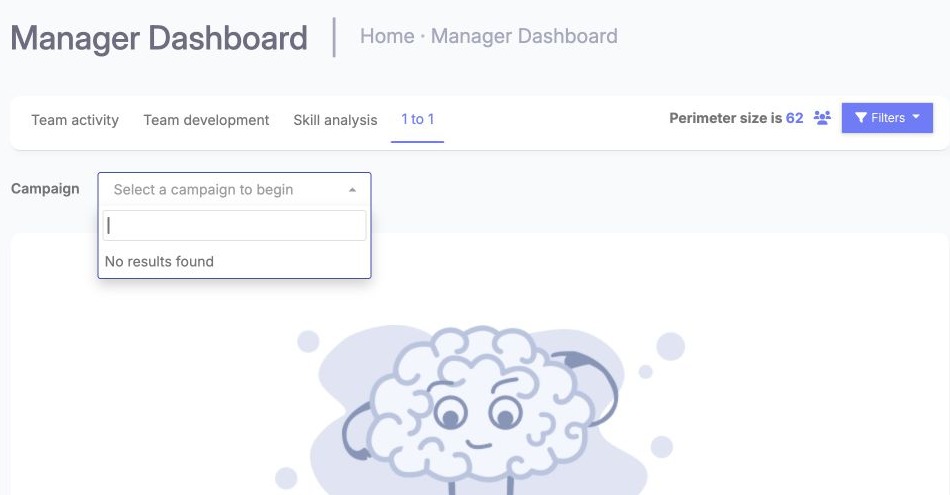
If the campaign selector has no matching results, clear a restrictive query or review campaign availability and scope before interpreting progress.
Skills-map campaigns
When enabled, the skills-map campaign tab provides campaign completion and progression information.
When enabled, panels cover completion, progression by step, employees who have not started and changed skills. Select a campaign row to open progression or not-started details. Select a progression bar to display employees at that step; deselect to close the detail. Clicking the selected campaign again clears the associated detail.
When using a campaign drill-down, check its displayed population before comparing it with an overview that includes relationships. Changing a campaign selection does not change participation or campaign settings.
Search, display and export
Table search filters the linked table; clear its text to remove that search. A chart selection can also narrow the table, so clear the selection or search to return to a wider list. Available display options can vary by panel.
Where shown, use the table download to export the filtered rows in that table. This is separate from the chart image actions and the Export Center. Chart actions vary by panel and can include full screen, printing and image formats. Handle exported employee data according to your organization’s access and privacy rules.
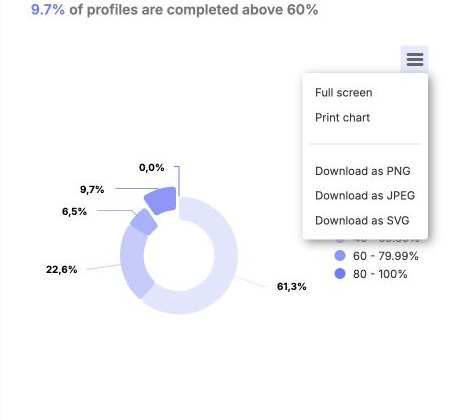
The chart menu offers full-screen, print and image-download actions. Choose a format for the chart; use the separate table download when you need the filtered employee rows.
Analytics access from personal space
Team analytics are available from the manager area. Employees may contribute profile, skill or interview data without access to team analysis. A person with both roles must use their authorized manager view; switching spaces does not itself grant permissions. Use the Apps switch to return to Manager area when authorized.

Use the workspace switch to move between personal and manager spaces when your account is authorized for both. Personal navigation does not itself grant team-reporting rights.
Rules, errors and troubleshooting
| Situation | Action |
|---|---|
| Sign-in page | Restore the authorized session, then reopen the dashboard. |
| Access denied or no tabs | Ask the administrator to check access and tab activation; a page-level permission alone may leave no enabled tabs. |
| No selected filter | Choose at least one level or supported relationship and apply. The server rejects an empty filter set. |
| Empty perimeter | Check active employees, hierarchy, relationship assignments and visibility. Empty data is not proof of zero skills. |
| Missing panel | Check panel activation and data prerequisites; do not assume it exists in every tenant. |
| Long load or stale detail | Wait for the response, reapply the intended population, and reopen the detail. The delayed message appears after 15 seconds; this is not a refresh schedule. |
| Different counts across panels | Check search, job restriction, campaign participation and relationship handling before treating it as a data discrepancy. |
Interface generation
The manager dashboard workflow described here uses the legacy interface. Its availability and panels depend on the company configuration; see the technical guide for implementation details.
Last updated on 3 November 2026